The γ-ray spectrum of the low-frequency-peaked BL Lac (LBL) object AP Librae is studied, following the discovery of very-high-energy (VHE ; E>100GeV) γ-ray emission up to the TeV range by the H.E.S.S. experiment. This makes AP Librae one of the few VHE emitters of the LBL type. The measured spectrum yields a flux of (8.8±1.5stat±1.8sys)×10−12 cm−2s−1 above 130 GeV and a spectral index of Γ=2.65±0.19stat±0.20sys. This study also makes use of \textitFermi-LAT, observations in the high energy (HE, E>100 MeV) range, providing the longest continuous light curve (5 years) ever published on this source. The source underwent a flaring event between MJD 56306-56376 in the HE range, with a flux increase of a factor 3.5 in the 14-day bin light curve and no significant variation in spectral shape with respect to the low-flux state. While the H.E.S.S., and (low state) Fermi-LAT fluxes are in good agreement where they overlap, a spectral curvature between the steep VHE spectrum and the Fermi-LAT, spectrum is observed. The maximum of the γ-ray emission in the spectral energy distribution is located below the GeV energy range.

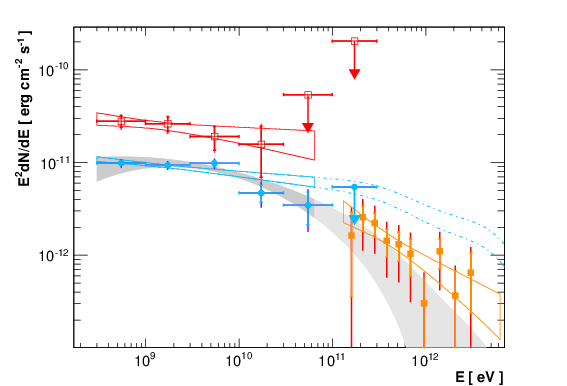
The γ-ray SED of AP Librae from Fermi-LAT (blue circles) and H.E.S.S. (orange squares and butterfly power-law fit). For the quiescent state, the Fermi-LAT best-fit power-law (blue butterfly) has been extrapolated toward the H.E.S.S. energy range taking EBL absorption into account (dash-dotted line). The Fermi-LAT log- parabola fit is shown in gray, and its extrapolation taking the EBL absorption into account is shown in light gray. The flare SED as measured by Fermi-LAT is given by the red butterfly and open squares. The shorter and longer errors bars indicate statistical-only and the quadratic sum of statistical and systematic uncertainties, respectively

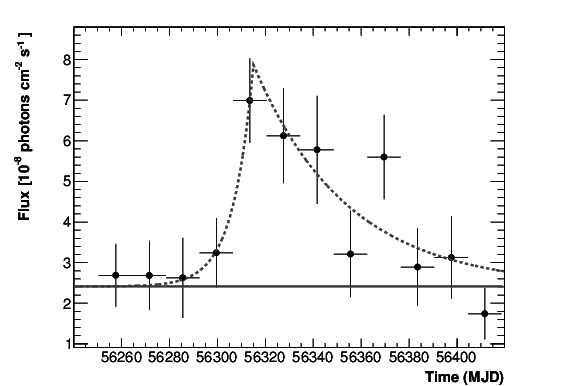
Flux above 300 MeV of Ap Librae during the flare detected by the Fermi-LAT with 14 days integra- tion time. The dashed gray line is the result of the fit with an asymmetric exponential profile plus a constant


